
Risks, Budget & Contingency Questionnaire
Using information on risks and opportunities to select a budget and a contingency reserve - Game F
How to use
Select a manager profile and a scenario. In Step 1, use the risk and opportunity tables together with the reference tables to compute each value (Impact% × Probability%), sum them up, and enter your totals. In Step 2, use your Q1 result and the manager profile rule to answer Q2–Q5, then submit your answers in SimSE.
Select a manager profile and a scenario. In Step 1, use the risk and opportunity tables together with the reference tables to compute each value (Impact% × Probability%), sum them up, and enter your totals. In Step 2, use your Q1 result and the manager profile rule to answer Q2–Q5, then submit your answers in SimSE.
Q1 = Σ risks − Σ opportunities | Q2 = base budget (profile rule) | Q3 = Q1% × Q2 | Q4 = max(ceiling − Q2, ceiling × 5%) | Q5 = Q2 + Q3 + Q4
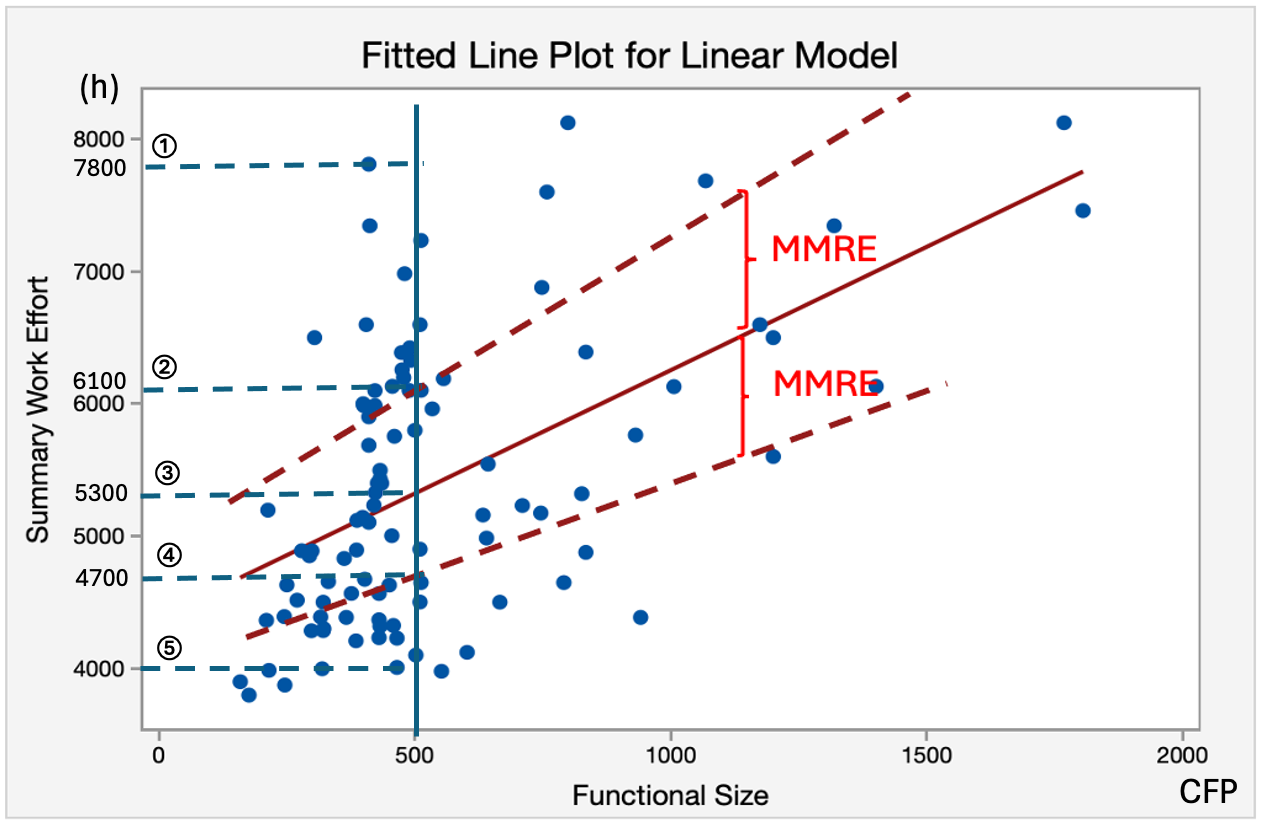
Linear regression model - 500 CFP project
Risks - effort impact % by level
| # | Risk | Low | Medium | High |
|---|---|---|---|---|
| 1 | Developers with less technical skills than planned | 2% | 3% | 4% |
| 2 | Communication problems between users and software developers | 1% | 3% | 7% |
| 3 | Software architecture more complex than expected | 1% | 5% | 12% |
| 4 | More functional requirements changes than expected | 1% | 10% | 40% |
| 5 | Users not available in time to review and approve specifications | 1% | 2% | 3% |
| 6 | Users not available in time to conduct user testing | 2% | 5% | 7% |
| 7 | Required technical support staff not available in time | 1% | 2% | 3% |
Opportunities - effort reduction % by level
| # | Opportunity | Low | Medium | High |
|---|---|---|---|---|
| 1 | Users decide to decrease functions by 20% | 5% | 10% | 20% |
| 2 | Testing tool utilization is much more productive | 2% | 4% | 7% |
| 3 | Improved user communication for reviews & approval | 1% | 3% | 8% |
Probability levels
| Level | Probability range |
|---|---|
| Remotely | 0% – 5% |
| Unlikely | 6% – 30% |
| Likely | 31% – 70% |
| Highly likely | 71% – 95% |
| Near certainty | 96% – 99% |
Manager profiles
| Profile | Budget selection |
|---|---|
| High risk-taking | Selects the minimum of the range |
| On-target strategy | Selects the maximum of the range |
| Balanced risk-mitigation | Selects the midpoint of the range |
Select a manager profile & scenario
Click "Play" to open the two-step calculator for that combination.
Profile A
High risk-taking
Selects the minimum of the estimation range
Scenario 1 - Range 5 (4,000h – 4,700h)
Scenario 2 - Range 2 (5,300h – 6,100h)
Scenario 3 - Range 1 (6,100h – 7,800h)
Profile B
On-target strategy
Selects the maximum of the estimation range
Scenario 1 - Range 5 (4,000h – 4,700h)
Scenario 2 - Range 2 (5,300h – 6,100h)
Scenario 3 - Range 1 (6,100h – 7,800h)
Profile C
Balanced risk-mitigation
Selects the midpoint of the estimation range
Scenario 1 - Range 5 (4,000h – 4,700h)
Scenario 2 - Range 2 (5,300h – 6,100h)
Scenario 3 - Range 1 (6,100h – 7,800h)